|
|
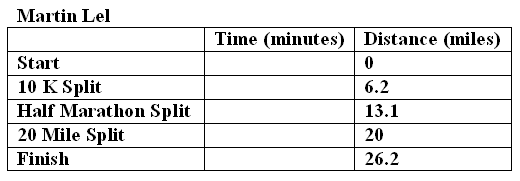
Estimated Pace for this section: 1 hour Required Equipment: Race Log (Click to download Word Document) The Race Page: 1 | 2 | 3 | 4 | Next> After completing this section you will be able to create and interpret distance vs. time graphs in regards to their slopes. The Race Part 1: Martin Lel Now you are finally ready for the big day. The winner of the 2003 New York City Marathon was Martin Lel of Kenya. In this section of the race you will collect data from Lel's run, create a graph of his race, and interpret the graph. In the second section you will compare P. Diddy's race data to Lel's and in the third section you will develop data for your own race and compare it to the other two. Step 1: Collect the Data Start by collecting the data on Lel's race. Go the NYC Marathon Results Page and click on "Results Archive (1970-2004)" on the left (View Pic). In the pop-up window select "Show Marathoner History" and enter the first name "Martin" and last name "Lel" (View Pic). Click "go" on the bottom of the pop-up window to see statistics for Lel. Use this data to fill in the table below in your Race Log (View Pic).
Step 2: Make a Graph Go to http://nces.ed.gov/nceskids/createagraph/ and select "XY" as your graph type. Follow the tabs in the graph maker to desing your graph. Be sure to choose "line" as the "XY Type" in the design tab. Give your graph appropriate tiles and lables. When you are done use the "Print/Save" tab to save your graph and a .JPG picture and then insert it into your Race Log. Click here if to view step-by-step instructions for creating your graph. DO NOT CLOSE YOUR GRAPH WINDOW IN CREATE-A-GRAPH. You will be adding data to the same graph on the next page. Step 3: Interpret the graph. Answer the following questions about Martin Lel's graph in your Race Log. 1) What is the shape of the graph? 2) Find the slope of the graph between the first two points. 3) Find the slope of the graph between the last two points. How does it compare to the slope in number 2? 4) What conclusion can you make about the runner's pace based on the graph? (For example, were there sections of the race when he ran faster or slower than other sections?) 5) What do you think would be a good estimate of Lel's average speed during the race? Explain how you found your value and why it is appropriate. |