|
|
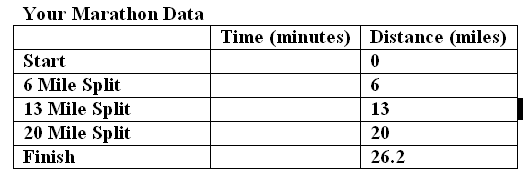
Estimated Pace for this section: 1 hour Required Equipment: Race Log (Click to download Word Document) The Race Page: <Previous | 1 | 2 | 3 | 4 | Next> The Race Part 3: Your Race Now it's your turn to run the marathon. In this last stage of the race you will estimate the time it would take you to run a marathon and compare your race to Martin Lel and P. Diddy. Step 1: Collect the Data Start by thinking about how fast you can run a mile. Maybe you ran a mile in gym class or for in practice for a sport. If you havn't ran a mile before most people in decent shape could run a mile in 8-10 minutes. People who excercise regularly and stay in good shape could probably run a mile in 7-8 minutes. To run a mile in less than 7 minutes means that you are in very good shape. Now think about how long it would take you to run each mile if you ran 26 miles. You would probably slow down some, so what would be a good average speed per mile? Choosing your fastest speed per mile Once you have an idea of how fast you think you could run a mile, and how much you think you may slow down go to this Marathon Split Caclulator to calculate your data. This calculator will allow you to enter your time per mile, and then a second time per mile after you "fade". Or you can enter your target marathon total time. Play around with it some until you think you have data that is appropriate for you. Then fill in your data in your Race Log as seen in the table shown below. Notice that your distances are different than the other runner's because the Marathon Split Caclulator only gives distances in exact miles.
Step 2: Make a Graph Go back to the graph that you made at Create-A-Graph and click on the "Data" tab. On the "Groups" dropdown-menu select "3" (View Pic). Fill in your data in the group three area. Click on the "Preview" tab to se your new graph with all three sets of data. When you are done use the "Print/Save" tab to save your graph as a .JPG picture and then insert it into your Race Log. Step 3: Interpret the graph. Answer the following questions about your graph. 1) Find the slope between the first two points of your graph? 2) What is the slope between the last two points of your graph? 3) How does your slope compare to the slopes of Martin Lel and P. Diddy? Who would come in first, second, and third in your race? 4) What do you think would be a good estimate of your average speed during the race? Explain how you found your value and why it is appropriate. 5) Do you think that this data represents how you would really run a marathon, why or why not? How would your "real" graph look different from this gaph? |
