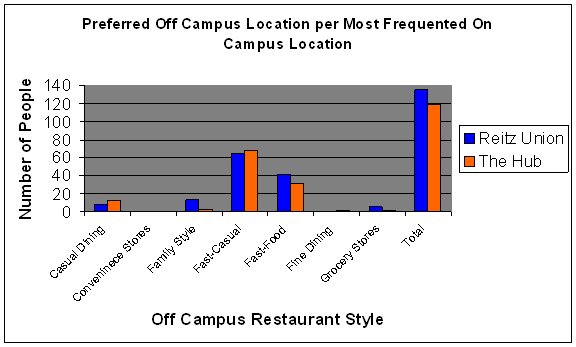
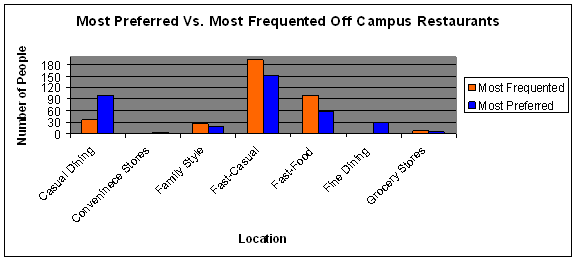
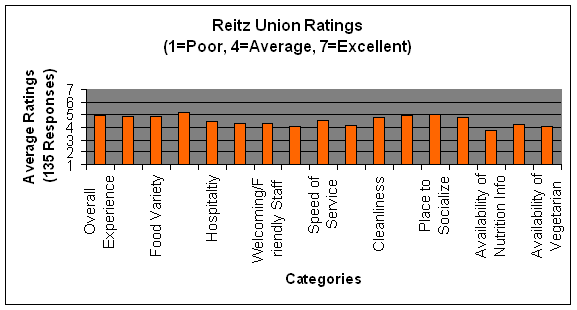
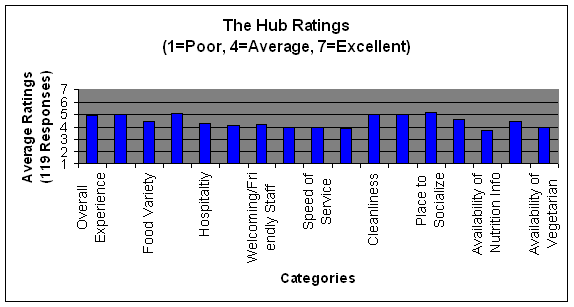
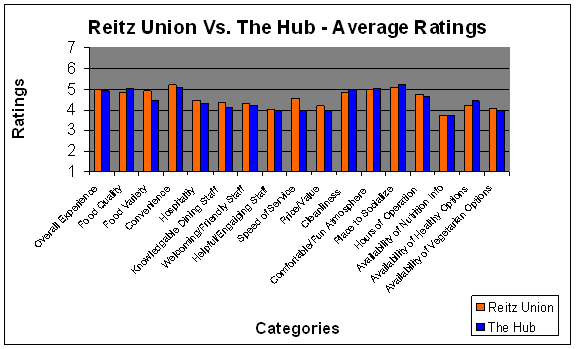
Charts and graphs based on our findings from the surveying
Comparison Of The Hub and The Reitz Union |
Reitz Union |
The Hub |
Overall Experience |
4.95 |
4.9 |
Food Quality |
4.84 |
5.01 |
Food Variety |
4.9 |
4.45 |
Convenience |
5.2 |
5.07 |
Hospitality |
4.45 |
4.32 |
Knowledgeable Dining Staff |
4.33 |
4.1 |
Welcoming/Friendly Staff |
4.31 |
4.22 |
Helpful/Engaging Staff |
4.04 |
3.93 |
Speed of Service |
4.53 |
3.95 |
Price/Value |
4.19 |
3.92 |
Cleanliness |
4.81 |
4.99 |
Comfortable/Fun Atmosphere |
4.96 |
5.01 |
Place to Socialize |
5.06 |
5.2 |
Hours of Operation |
4.76 |
4.61 |
Availability of Nutrition Info |
3.73 |
3.71 |
Availability of Healthy Options |
4.24 |
4.43 |
Availability of Vegetarian Options |
4.07 |
4 |

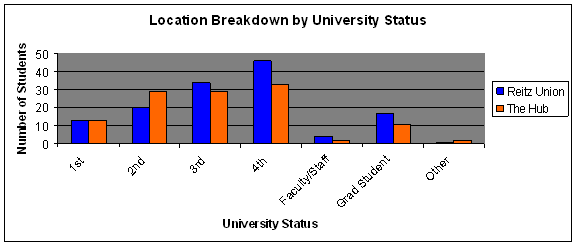
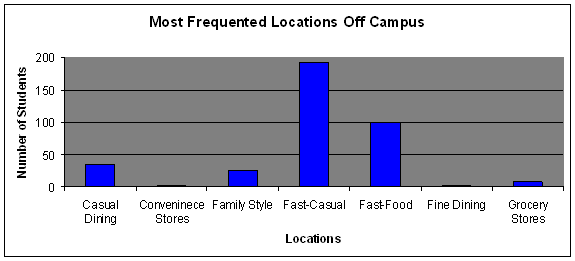
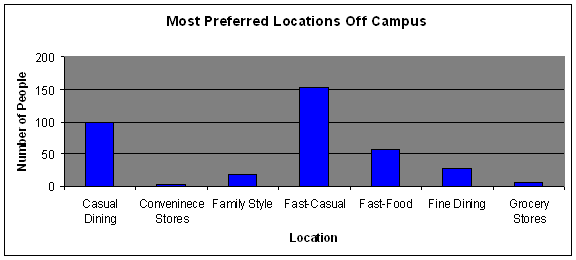

Avg. Spending on Lunch |
Number |
Percent |
|
$0-$.99 |
8 |
2.2 |
|
$.99-$1.99 |
5 |
1.4 |
|
$1.99-$2.99 |
12 |
3.3 |
|
$2.99-$3.99 |
31 |
8.5 |
|
#3.99-$4.99 |
51 |
14 |
|
$4.99-$5.99 |
141 |
38.6 |
|
$5.99-$6.99 |
50 |
13.7 |
|
$6.99-$7.99 |
38 |
10.4 |
|
$7.99-$8.99 |
18 |
4.9 |
|
$8.99-$9.99 |
0 |
0 |
|
$10.00 and Up |
11 |
3 |
|
|
|
|
|
Team - Recommendations - Analysis - All You Can Eat - Vending - Powerpoint
Back to Homepage