
Sample PLIF Images
Supercritical Injection into Subcritical Atmosphere
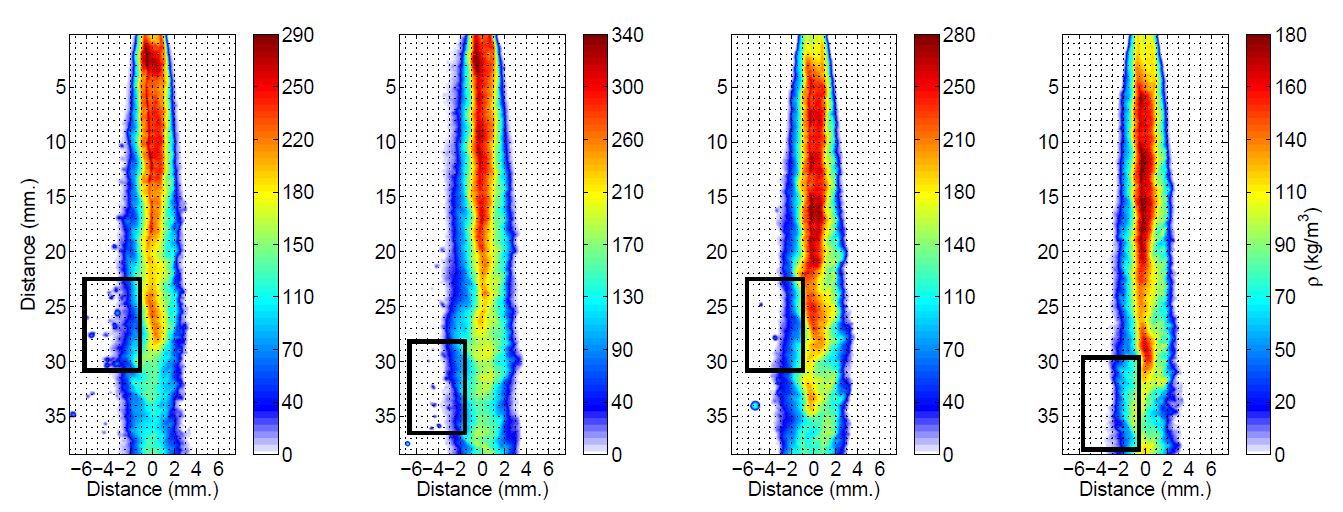
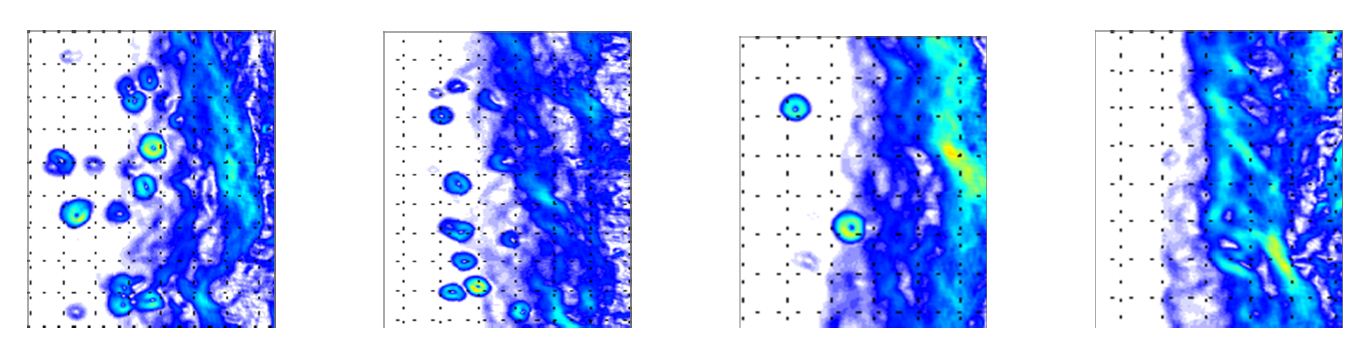
Figure: Scaled images of a supercritical jet injected into subcritical chamber conditions. Test conditions correspond to cases 1-4 in Table 1. The top row represents density images while the bottom row represents the zoomed-in density gradient images.
In these test cases, the fluid was preheated to supercritical temperatures before injection into
the chamber which was maintained at subcritical conditions. Both were at supercritical pressures.
Representative test cases 1 through 4 have been listed in Table 1. The cases have been chosen
such that chamber and injectant temperatures are in increasing order of magnitude. The figure above shows
the respective images of the listed test cases. Density images have been shown on the first row,
while zoomed-in density gradient images of the gas-jet interface are shown below the corresponding density images.
Since the fluid is in a supercritical state when it is being injected, the surface tension effects are
negligible in the initial mixing region, which is very close to the injector at around 5-10 injector
diameters. Typical characteristics of supercritical injection are noted in this region, including a smooth
jet-gas interface and occasional formation of 'ligaments' and clusters. Further downstream of the injector,
the jet interface changes. In the left most figure, it can be seen that several droplets form beyond 10 injector
diameters from the injector and detach from the main body of the jet. This is due to the heat transferred from
the jet as it is injected into a significantly cooler medium, and hence the conditions become locally subcritical.
Any portion of the jet that breaks off will cool below the critical temperature and form spherical droplets due to
surface tension forces gaining importance. This effect is most prominent in the first two cases, where the temperature
of the chamber is the lowest, causing the greatest heat transfer. The temperature of the surrounding environment
gradually increases from left to right and droplets gradually disappear since local conditions are not cool enough
to cause subcritical phenomena to exist. Density gradient values also gradually decrease due to the increase in temperature
of both the surroundings and the injectant.
Supercritical Injection into Supercritical Atmosphere
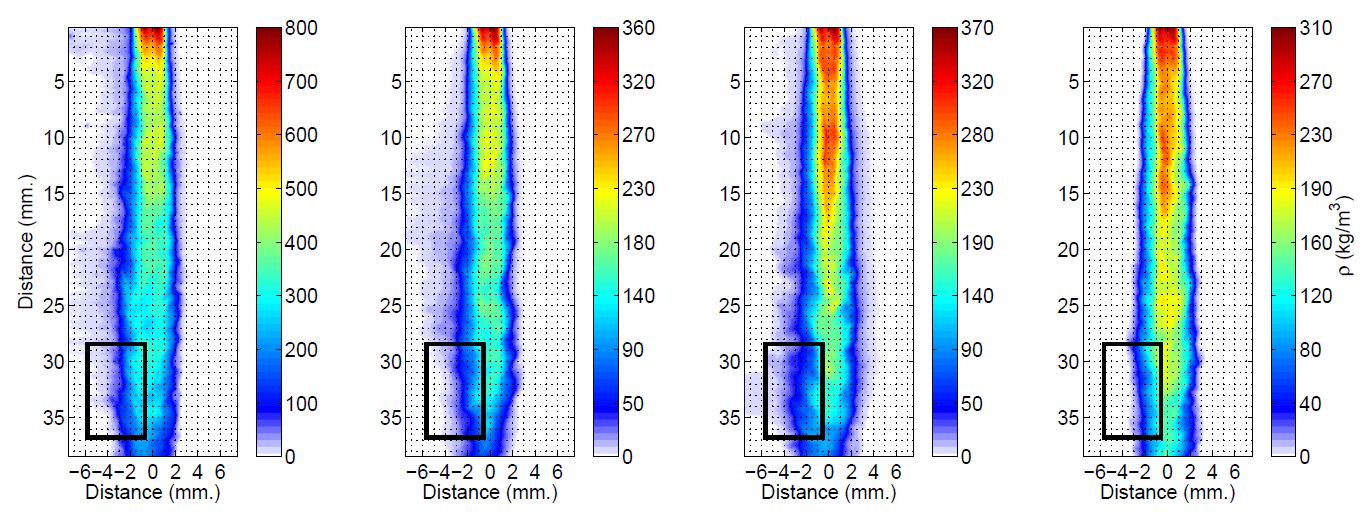
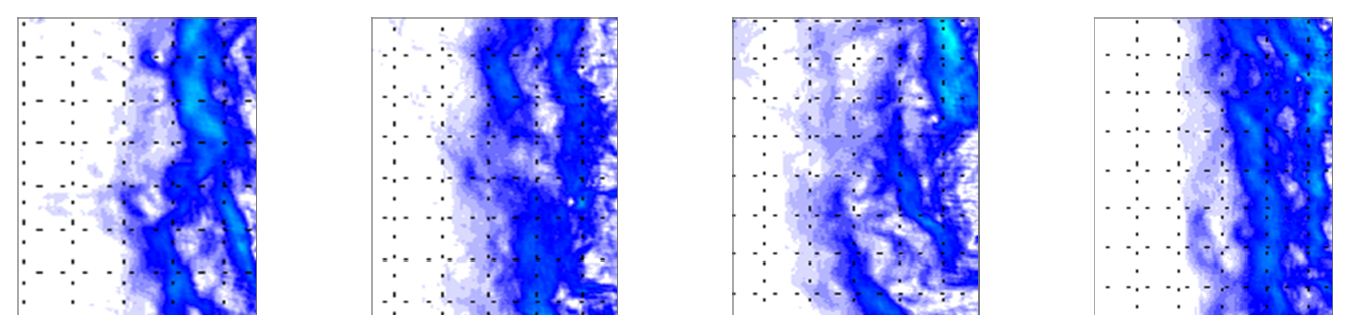
Figure: Scaled images of a supercritical jet injected into supercritical chamber conditions. Test conditions correspond to cases 5-8 in Table 1. The top row represents density images while the bottom row represents the zoomed-in density gradient images.
To compare the differences in the gas-jet interface appearance and the breakup process
with those of the previous section, supercritical
fluid was also injected into a supercritical
environment. Representative test cases 5 through 8 have been listed in Table 1 in increasing order
of chamber and injectant temperatures and pressures. The figure above shows the
respective images of the listed test cases as in the earlier case. Density images have been
shown on the first row from left to right, while the respective zoomed-in density
gradient images of the gas-jet interface are shown on the second row. The fl
uid in these
injection conditions exhibit complete supercritical behavior. The figures show no effects
of surface tension or droplet formation as far as 20 jet diameters from the injector even at
lower chamber temperatures. There are some finger-like entities that emerge from the jet but
do not break up into droplets as the previous case. The images progressively resemble the injection
of a gaseous turbulent jet into a gaseous environment with increasing temperatures and pressures as
observed by other researchers (Mayer et al. 1998; Chehroudi et al. 2002; Oschwald et al. 2006).
This is clearly demonstrated in the last row of images where the gas-jet interface has been zoomed in.
The density-gradient magnitudes also continue to decrease.
The last two sets of images in the figure of the earlier section show resemblance to the second wind-induced breakup regime
according the classical breakup theory (Reitz & Bracco 1982; Lin & Reitz 1998). When the conditions
approach supercritical values for the chamber, the jet gradually begins to take the appearance of a gas
jet without entering the atomization regime as seen in the figure above. This departure from the classical
jet breakup behavior occurs due to the reduction of surface tension and the heat of
vaporization to a near-zero value at and above the critical point. The mixing process
is enhanced drastically in this regime since the behavior is more like gas-gas mixing. In
the supercritical-into-subcritical cases, the formation of droplets indicates the need for
vaporization of the same in order to effciently mix with the surroundings, and hence
directly affecting the combustion effciency.