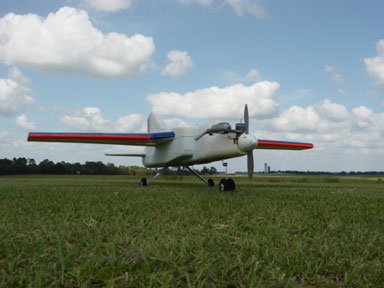
Figure 1: Mig-27 ready to take off
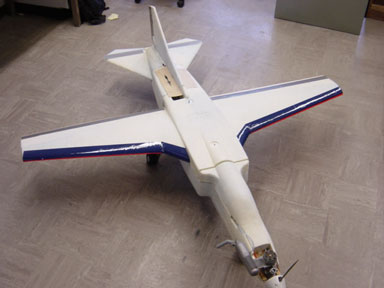
Figure 2: Back at the lab... in one piece!
Flight Data and Preliminary Analysis from Reverse Cuban-Eight Maneuver
|
|
|
|
Figure 1: Mig-27 ready to take off |
Figure 2: Back at the lab... in one piece! |
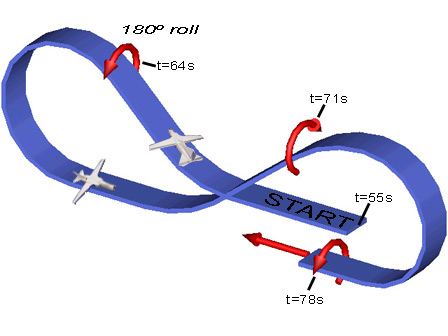
Figure 3: Diagram of flight maneuver
The figures below show the sensor output of the on-board instrumentation during an aerobatic flight sequence. While the actual flight test maneuvers needed for aircraft characterization are much more benign, these aggressive maneuvers enable researchers to understand sensor measurement limitations and verify that the devices are working properly. In addition to providing tired researchers large amounts of enjoyment, the maneuver shown in Figure 1 excites nearly every sensor carried on-board the aircraft.
Note that in all the graphs, the calibrated "zero" value for the sensors is relative to the starting position. I.e. any change in the sensor reading is shown by a positive or negative shift in the graph. The plots are presented for qualitative comparison of the aircraft response during the maneuvers. Detailed quantitative analysis will follow.
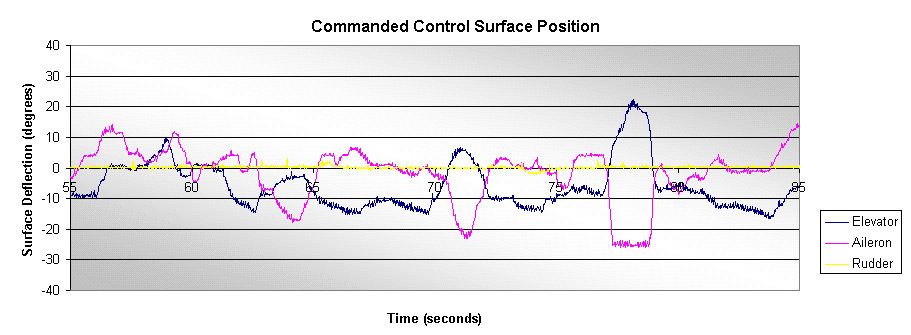
Figure 4: Position feedback from flight control servos
This colorful array of squiggles shows the control input during the maneuver. The important parts to note are the low parts of elevator (blue) line. These indicate "up-elevator" portions of the control during loops. Also note the aileron actuation during the 180º rolls. The "down-elevator" during the rolls is to maintain altitude while inverted.
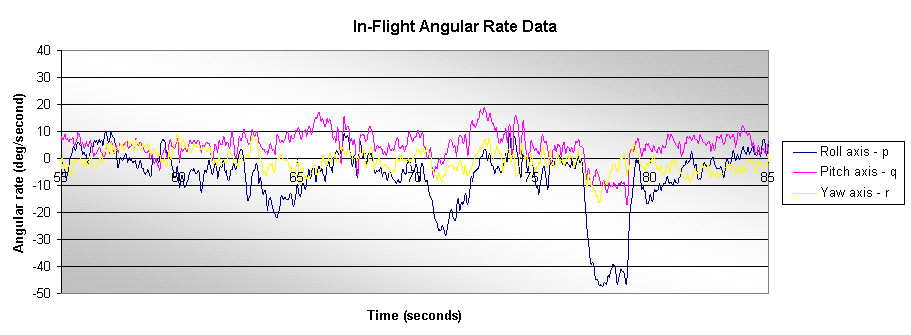
Figure 5: Angular rate output about aircraft axes
Angular rate information - the one thing that keeps flight test researchers employed. Angular rate data gives some of the most important information when analyzing the flight characteristics of a flight test vehicle. In this particular case, the change in pitch and roll rates can be seen in phase with the control actuation described above. The change in the roll rate is more pronounced than the roll, as seen by the downward peaks of the blue line. This is largely true for most aircraft, which tend to perform rolls much faster than loops or other pitch changes.
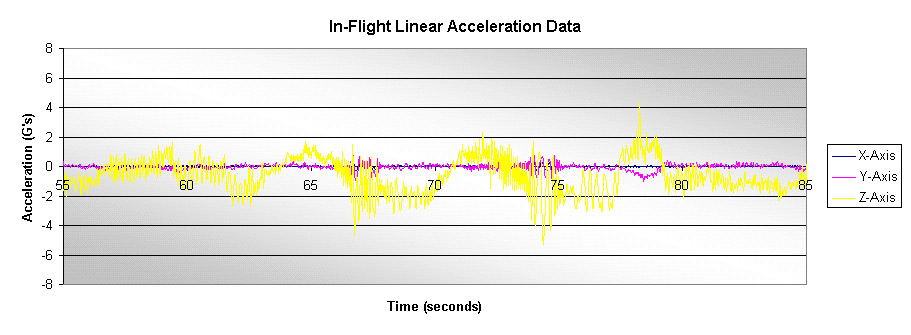
Figure 6: Linear acceleration output about aircraft axes
The nature of the maneuver performed primarily excites the vertical acceleration axis. After applying a filter to the typically noisy accelerometer data, it becomes evident that the sensor output corresponds well with intuition - loading increases during the looping portions of the flight and returns close to the nominal value during roll and level flight phases.
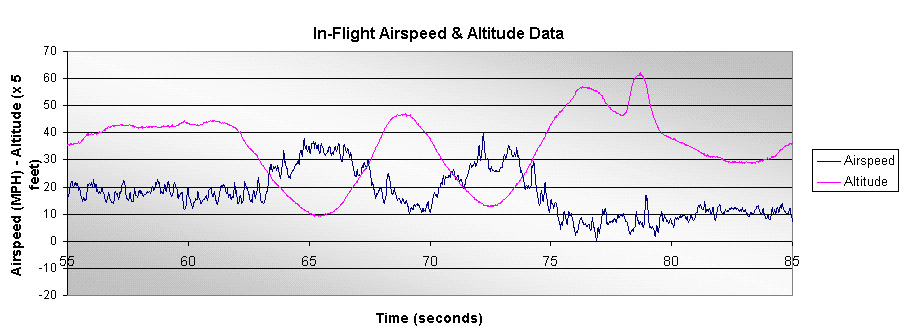
Figure 7: Pressure sensor output calibrated to physical units
Figure 5 above shows the output from two pressure sensors, a differential port for the pitot-static system (airspeed) and an absolute pressure sensor for altitude. The important aspect of this graph (from a qualitative analysis standpoint) is the inverse relation between airspeed and altitude. At the top of the loop, the altitude is highest and airspeed is lowest. As the aircraft continues through the maneuver, the graphs change out of phase, adding basis to the argument that these sensors are not so bogus after all.
Phase II - Controls Characterization
Coming Soon!