Coin
Recognition
University of Florida
Pattern Recognition
EEL 6825
December 8, 2002
Developed By
Seth McNeill
Joel Schipper
Taja Sellers
Introduction:
The goal of this project was to create a coin recognition system to recognize the tail side of standard US coins using Mathematica. More specifically, the program was designed to differentiate between the bald eagle on the quarter, the torch of liberty on the dime, Thomas Jefferson's house on the nickel, and the Lincoln Memorial on the penny. Originally, the desired outcome was that the program would be able to recognize coins regardless of rotation, with reasonable variations in size and lighting, and be able to process multiple coins in real time. It was also hoped that more than one form of feature extraction and object recognition could be tested, including a uniform histogram function that was written. As the project progressed, alterations were made to the goals based on the invasions of reality and time into our dream world of perfection. The current program has been trained to recognize single coins using offline vector quanitization based histogram processing and is rotation specific with a small degree of tolerancing.
Data Collection:
A program was written in Visual C++ to operate a PC cam and gather images for the training and testing of our system. During the data collection stage various background colors, including black, white, red, and blue, were tested for segmentability. Photoshop was used to determine the RGB values of the coin and its background. Then the segmentation program was applied to these images and the results were compared using the extremely precise method called “eyeballing.” From this extensive testing, red was determined to be the best background color, in Figure 1. Throughout the project, over 1300 pictures were taken with various rotations, lightings, and sizes. In the end approximately 400 images were taken with similar rotation, lighting, and size. These were used to train and test the system.
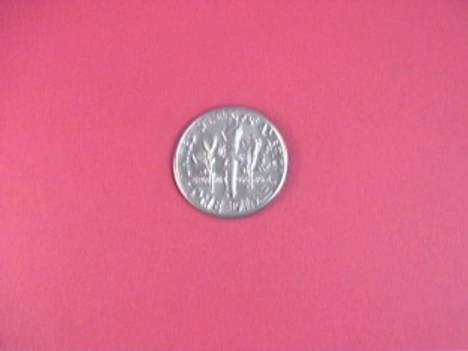
Figure 1: Dime with Red Background
Coin Segmentation and Cropping:
Coins were segmented from their backgrounds using a modification of Nechyba’s code (Nechyba's Statistical Modeling). Nechyba’s single threshold program was modified to allow independent thresholding of all three RGB values. The process of segmentation replaced all background pixels with an arbitrary replacement color. Once segmentation was completed, a cropping program was implemented to locate the edges of the coin. This was accomplished by calculating the average coordinates of the pixels associated with the coin. From this centroid, the cropping program searches outward in the positive x, positive y, negative x, and negative y directions, see Figure 2. When a user-defined number of consecutive pixels of the replacement color are encountered, the program defines the boundary of the coin as the first of these pixels and reduces the image to the size of the coin, see Figure 3.
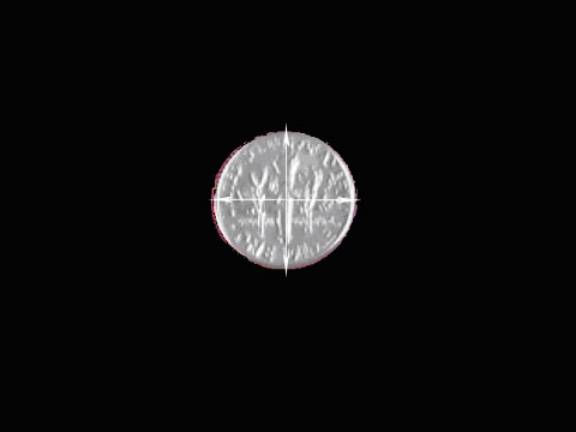
Figure 2: Coin Centroid and Search Vectors
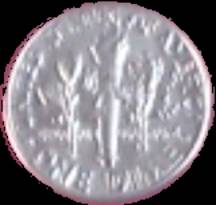
Figure 3: Cropped and Segmented Image
Feature Extraction:
Features were extracted from the coins by convolving texture templates with each image, with edge detection templates as the primary focus of the research. Eight different 3 x 3 edge detection templates were tested with various thresholds. Ultimately, it was discovered that the most information was gained using vertical edge detection. An example template and its resulting image are shown in Table 1 and Figure 4. The convolution produced a grayscale image. Then a threshold function parsed through the data, yielding the coordinates of all pixels that met the criteria. Figure 5 shows a thresholded image where pixels above the cutoff value were set to white and pixels below were set to black. Finally, the coordinates were normalized so that the x and y values of every image have a range of 1. This enables size independence in our images.
{-1, -1, -1} {0, 0, 0} {1, 1, 1}
{-1, -1, -1} {0, 0, 0} {1, 1, 1}
{-1, -1, -1} {0, 0, 0} {1, 1, 1}
Table 1: Vertical Edge Detection Matrix
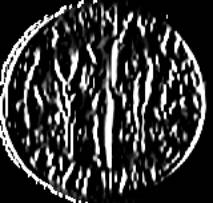
Figure 4: Vertically Edge Detected Image
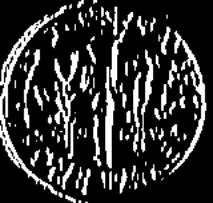
Figure 5: Thresholded Image
Training:
Five dimes, nickels, pennies, and quarters were used for training data. Approximately 10 pictures were taken of each coin at slightly different orientations, resulting in just over 200 images. The coordinates of every pixel were extracted from each image, compiled into one list, and passed through the Nechyba LBG Vector Quantization Function (NLBGVQF). Five LBG divisions were used, resulting in 32 centroids and their corresponding compartments, as shown in Figure 6. Finally, probability histograms were constructed for each of the four classes of coins.
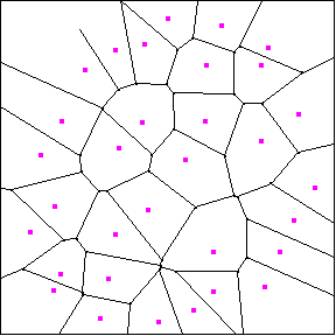
Figure 6: Vector Quantization Centroids and Partitions
Testing:
Five more dimes, nickels, pennies, and quarters were used for test data. Approximately 10 pictures were taken of each of these coins at slightly different orientations, resulting in approximately 200 images. In determining coin type, vertical edge detection is performed on a segmented and cropped test image. Next, the pixels are checked against a threshold value and the coordinates of pixels above the threshold are recorded. Then, a histogram model of the image is constructed using the vector quantization centroids from the training data. Finally, the log-likelihood that the image is a dime, nickel, penny, or quarter is calculated. Finally, a Bayes classifier is used to select the coin type with the highest probability. The result is compared with the file name, which corresponds to the coin type, and the program evaluates whether it classified the coin correctly.
Results:
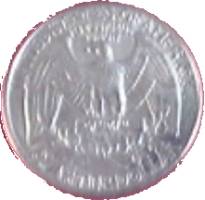
Of the 200 test images, 188 were classified correctly yielding a 94% accuracy. Of the misclassified coins, one quarter was particularly troublesome for the computer. As seen in Figure 7, the quarter appears to have more distinct feathering in the eagle’s wings. This caused the quarter to be classified as a dime because the dime tends to have more data points in the same region as the feathers. Another misclassified coin was a dime that had not been properly segmented, leaving traces of the red background in the image, shown in Figure 8.
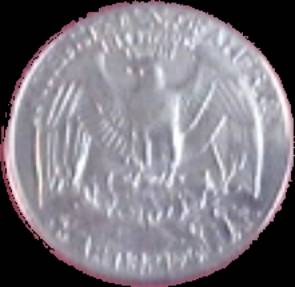
Figure 7: Misclassified Quarter

Figure 8: Misclassified Dime
Conclusion:
Under the testing conditions, our program was largely successful. The test conditions used, however, were quite favorable to the program. In generating the test images, the lighting and orientation of the coins were nearly identical to that of the training images.
Future work for the coin recognition system should proceed by testing the robustness of the system and seeking to increase its ability to recognize coins under a variety of conditions. Such training would include creating models for a greater variety of coin rotations as well as head sides of coins. Color could also be used to quickly differentiate pennies from the other coins. Furthermore, the current system is incapable of recognizing “non-coins.” Future systems might be given a threshold log-likelihood probability to determine of the object being tested is in fact a coin. Other forms of feature extraction could also be researched, such as the use of wavelets.
Works Consulted:
http://www.1ststeps.org/Social%20Studies/us_coins.htm
http://karkula.math.stthomas.edu/~radka/gemscamp/mathematica/
http://www.mil.ufl.edu/~nechyba/eel6825/lectures.html