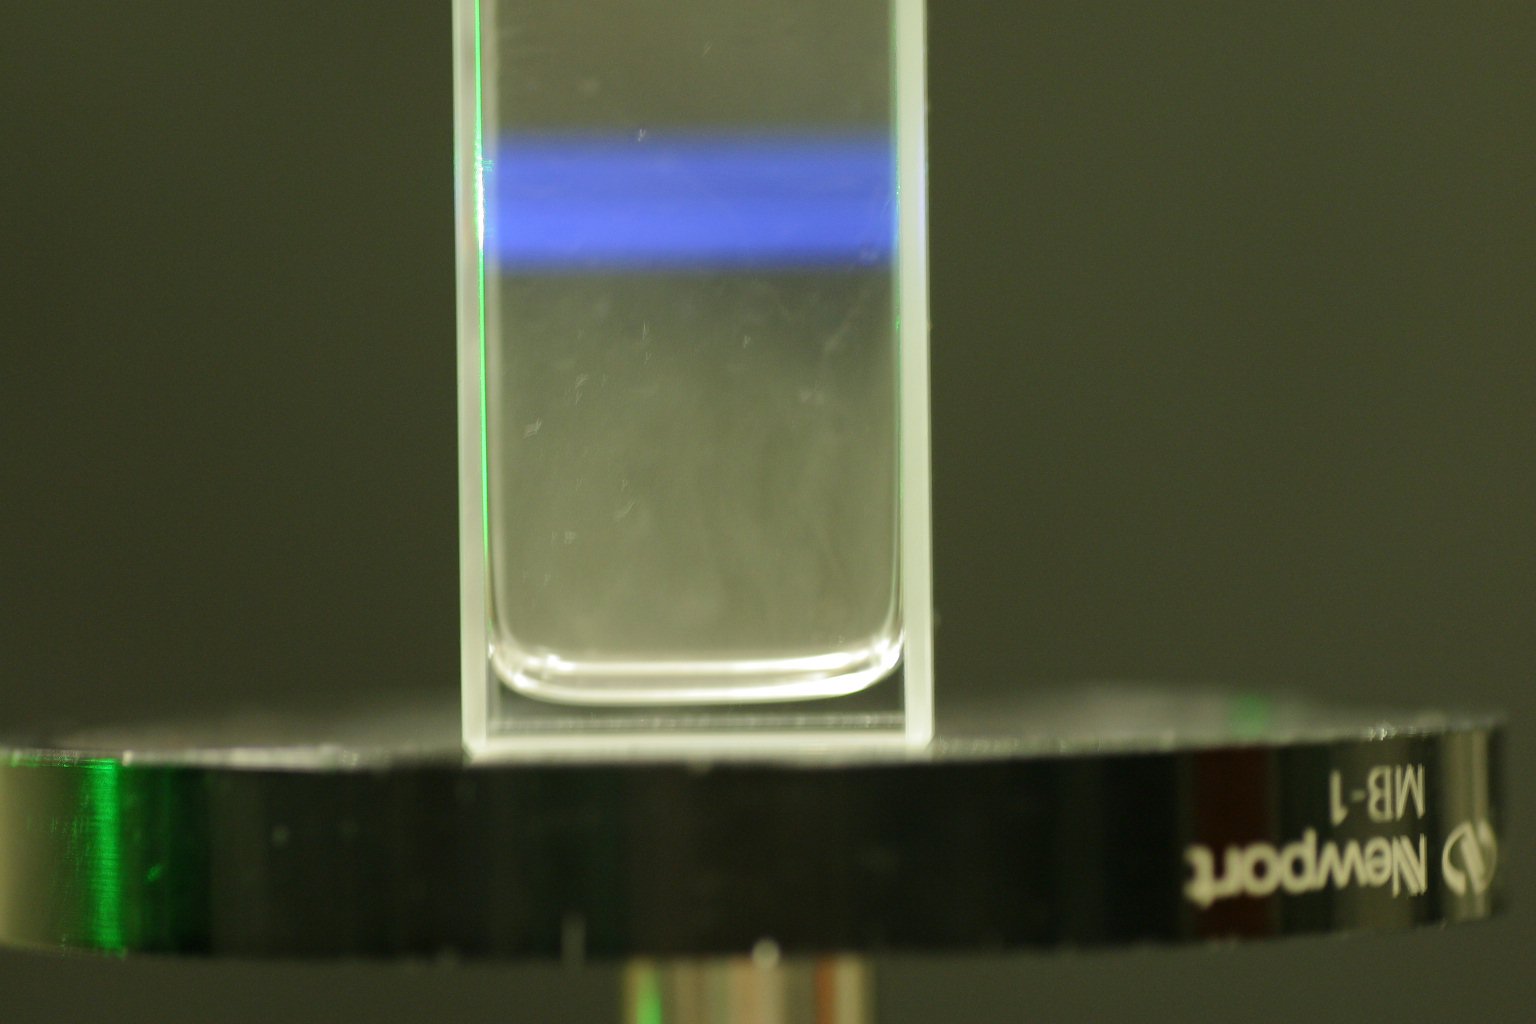
Acetone is frequently used as a tracer to study the mixing and in some cases combustion of fuel in combustors. The acetone is typically injected as a vapor mixed with the fuel and illuminated with a laser sheet in the UV region of the spectrum. This produces fluorescence at longer wavelengths (350-550 nm) which can be picked up by cameras observing the flow field. This technique is known as planar laser-induced fluorescence (PLIF). Following post-processing that compensate for laser intensity variations in time and space and acetone fluorescence efficiency variation due to temperature, pressure and gas composition variation, the acetone vapor concentration throughout the flowfield can be determined instantaneously and non-intrusively.
In the combustion lab with are applying this technique to determine the efficiency of mixing of fuel and air in the recirculation region and shear layer downstream of a rearward-facing step in a supersonic combustor. The mixing efficiency of different injection schemes and geometries are of great interest in the development of scramjet combustors where the fuel, typically hydrogen, will have to mix and combust with the incoming air in a matter of milliseconds. In the present experiment, acetone is introduced together with the fuel simulant helium through transverse injection downstream of a rearward-facing step and the downstream flow is illuminated with a 266 nm 70 mJ Nd:YAG laser sheet. Because of the low static temperatures and pressures in these cold-flow test, very sensitive intensified CCD cameras are employed to register the emitted fluorescence photons.
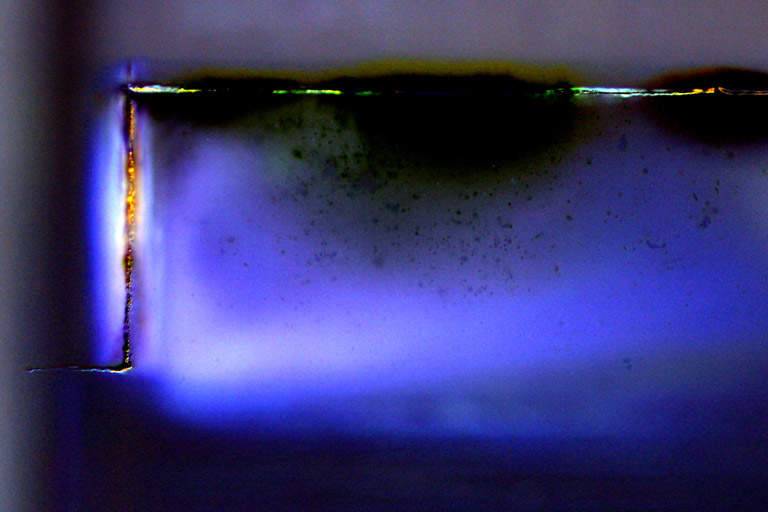
The below image shows a preliminary test in the actual combustion chamber, but using subsonic flow and the Canon D60 for image acquisition. The settings here were f/2.8 and 8 s exposure time (80 pulses). The flow was from left to right in the image with the acetone being injected transversely just downstream of the step. Note that while a background image has been subtracted to remove abient light and window scatter, the image has not been corrected for sheet non-uniformity or vignetting and hence the vapor concentration near the center of the image is exaggerated.

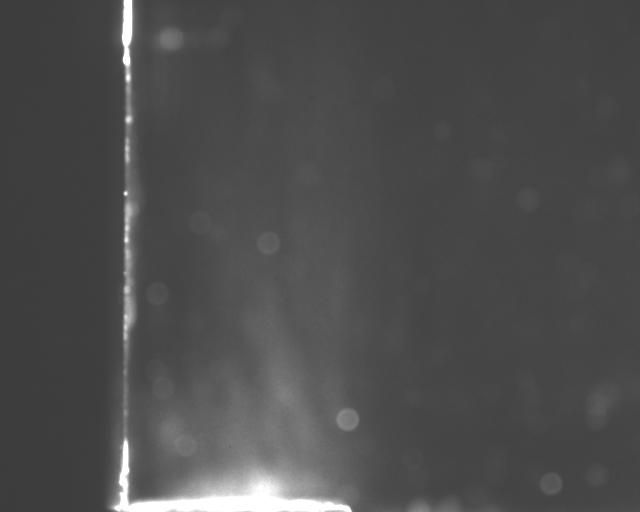
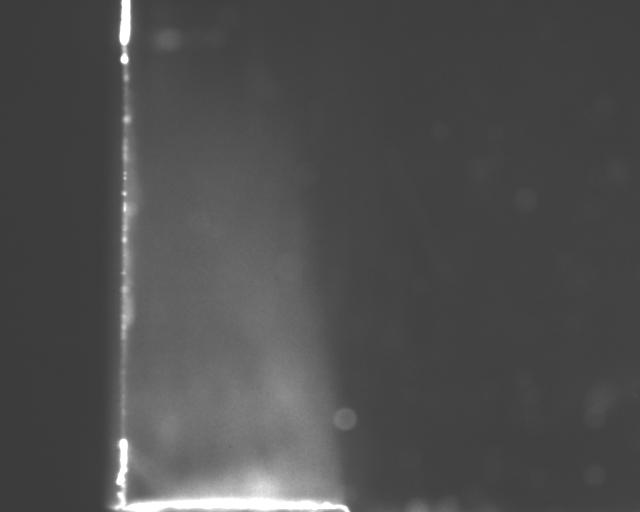
Each of these images is an average of 20 pulses: Background without the laser running (left), with laser running and acetone injected, but no flow in the tunnel (center) and with injection of acetone (80 psia, 0.55 Mpa) at a tunnel stagnation pressure of 70 psia (0.5 MPa) (right).
After subtracting the background image average from the sheet image and runtime image shown above, the following corrected average images were obtained.
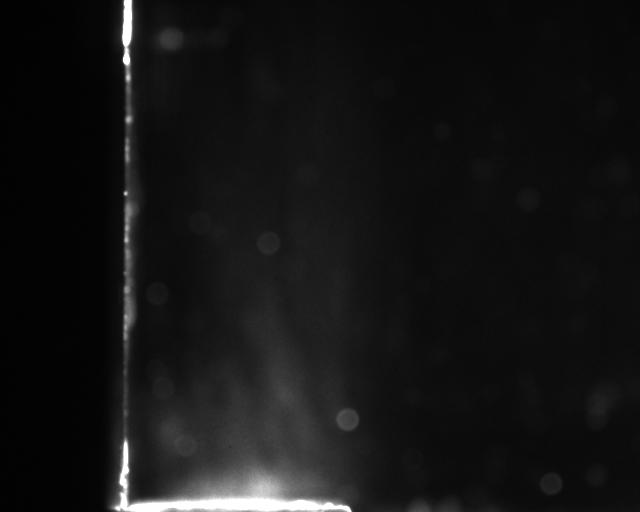
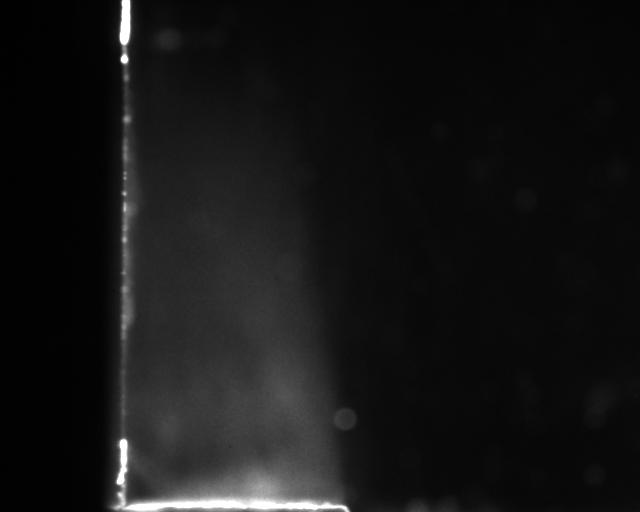
Corrected images without (left) and with (right) flow in the tunnel.
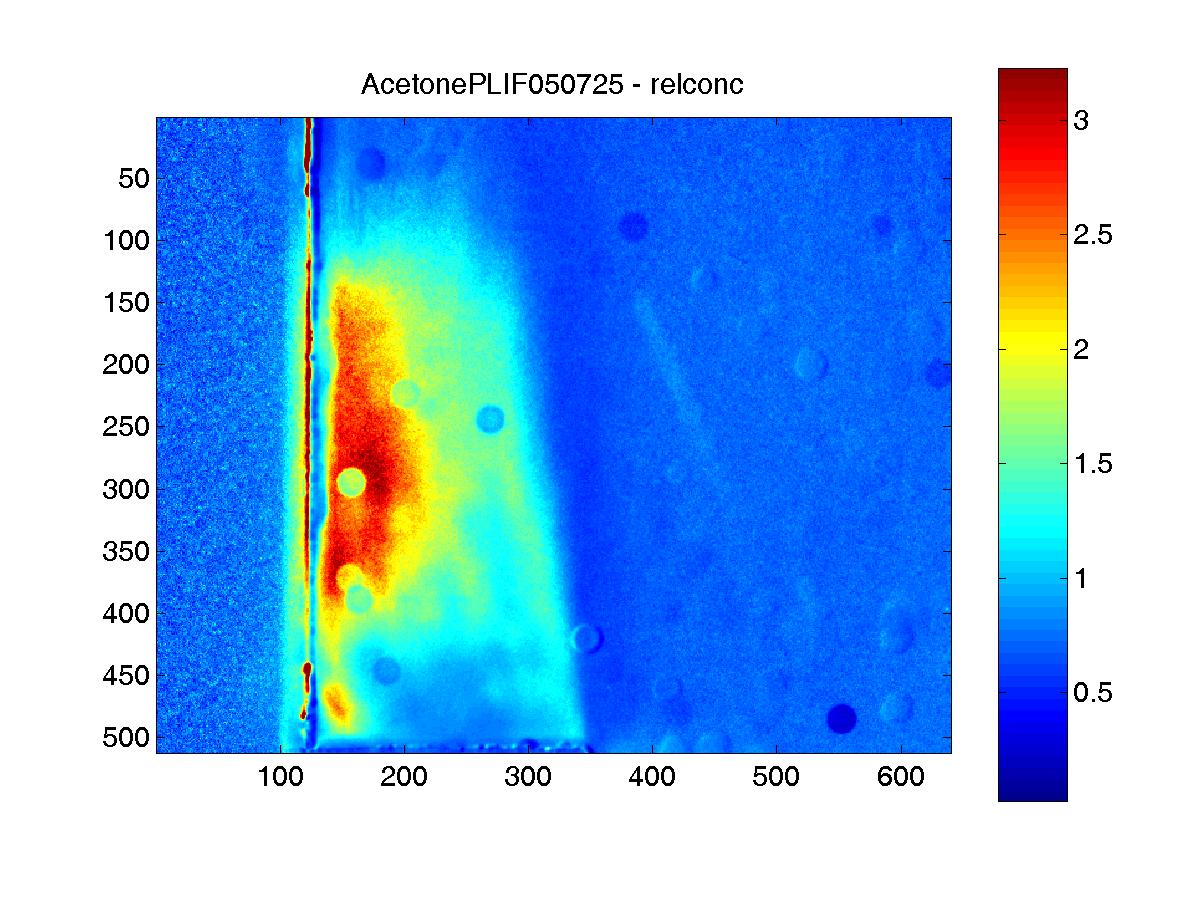
Dividing the corrected run-time image with the corrected sheet image gives an estimate of the relative acetone concentrations with and without flow in the tunnel as shown in the image below. The recirculation region downstream of the step can be clearly seen and the acetone concentration appears higher in the near-wall region than further out, showing a decreasing concentration even before the mixing layer is reached. The circular spots are due to out-of-focus spots on the windows. Note that significant acetone supersaturation and condensation are expected at these run conditions.
Back to the Combustion Lab home page