

![]()
Single Channel Noise
Suppression for Speech Enhancement
By : Jiaxiu He 6990-8943
Qi Zhou 9614-0635
1.
Introduction In
real life, speech is usually subject to noise and distortion, which result in
the loss of intelligibility of speech message. Therefore, the enhancement of
speech corrupted by noise is an important problem with numerous applications
such as suppression of environmental noise for communication systems and hearing
aids, enhancing the quality of old records. In
this project, we focus on spectral subtraction. The data is segmented and
windowed using 50% overlapping and is processed frame by frame. The original
phase is preserved while the spectral magnitude components are modified.
2.
Statement of the Problem
The task of the
project is to design an enhancement algorithm using spectral subtraction to get
an estimate of the uncorrupted speech while achieving the highest possible
intelligibility. Since it is hard to describe mathematically, we instead use the
mean squared value of the estimated error e as a measurement of this quality as well as the SNR improvement.
The properties of the noise
as well as the nature of corruption vary in various scenarios, so we make the
following assumptions in our project. The background noise is slowly varying,
additive and independent with the speech. It is relatively long-time stationary
compared with the speech so that its spectral magnitude expected values during
the speech activity remain almost the same as prior to the speech activity.
![]()
where
![]() is the original speech,
is the original speech,
![]() is the additive noise and
is the additive noise and
![]() the corrupted speech. Taking the
Fourier transform, we get
the corrupted speech. Taking the
Fourier transform, we get
![]()
where
![]() ,
,
![]() and
and
![]() .
.
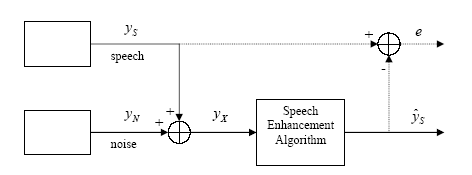
Figure
1 Structure of the problem
In this
project, we have implemented two spectral subtraction approaches. In both
algorithms, the input noisy speech data sequence is segmented and windowed into
50% overlapped frames. After spectral subtraction and all other processing, the
estimated speech signal segments are overlapped and added together to form the
enhanced speech sequence.
3.1 Spectral
Subtraction with Voice Activity Detection (VAD)
In this algorithm, we use
VAD to determine whether a signal sequence frame should be considered as speech
or non-speech. Noise spectrum estimates are calculated based on these frames
considered as non-speech. After spectral subtraction, we apply residual noise
reduction and additional attenuation during non-speech activities to reduce the
well-known “musical noise” as well as to further reduce the noise level. Figure
2 shows the structure of this algorithm.
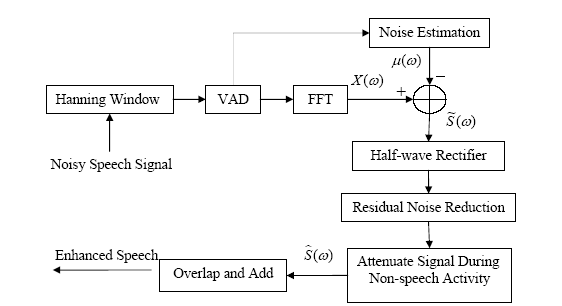
Figure
2 Block diagram of spectral subtraction using VAD
VAD: In each speech frame, the energy in the frame, E,
the linear prediction error normalized with respect to the energy of the signal,
LPE, and the zero-crossing rate, ZCR, are calculated. Using all these three
parameters, a compound parameter, D, is calculated as D=E(1-ZCR)(1-LPE). From
all the frames of the signal,
FFT: After doing
FFT, we use the average magnitude of three frames as the spectral estimate.
Taking average of 3 frames is to reduce the variance of the noise spectral
estimate while not violating the non-stationarity of speech too much. Noise
Estimation: The noise
estimation of each frequency bin is obtained by averaging the signal magnitude
spectrum
Spectral
Subtraction and Half-Wave Rectification: The
spectral subtraction estimate
where
After
subtracting, the differenced values are set to zero if having negative
magnitudes. Residual
Noise Reduction: For each
frequency bin i
where
Additional signal attenuation during non-speech activity During non-speech activities, we would like to further
attenuate the noise for more noise reduction. Let
, Then, the
output spectral estimate including additional attenuation during non-speech
activity is given by
where
3.2 Spectral
Subtraction with Time-Frequency Filtering The second
approach is a modified version of the first one. In this algorithm, we do not
use VAD to determine whether a frame should be considered speech or non-speech.
Instead, we use a recursive system to estimate the noise spectral estimate. If
the noisy speech spectral magnitude is much larger than the estimated noise
magnitude, then we considered it as a rough detection of speech. Therefore,
recursive accumulation stops and the prior noise estimate is used as the noise
estimate for the current frame, since we assume the noise is long-time
stationary compared with the speech. We use a
time-frequency filtering instead of residual noise reduction to reduce the
“musical noise”. Time-Frequency filtering is performed using several
preceding and frames and several frames following the frame of interest. This
filtering is to locate isolated peaks followed by attenuation. Figure 3 shows
the structure of this algorithm.![]() is computed. Then the value of
is computed. Then the value of
![]() is used to determine whether a
signal has speech activity or not. The threshold values have to be obtained
empirically. The frames are classified as speech and non-speech frames. The
non-speech frames will be used to obtain the noise magnitude spectrum estimate.
is used to determine whether a
signal has speech activity or not. The threshold values have to be obtained
empirically. The frames are classified as speech and non-speech frames. The
non-speech frames will be used to obtain the noise magnitude spectrum estimate.
![]() from the non-speech frames. This is
valid because we assume the noise is long-time stationary. Let
from the non-speech frames. This is
valid because we assume the noise is long-time stationary. Let
![]() be the estimate of noise spectral
magnitude.
be the estimate of noise spectral
magnitude. ![]() is obtained by subtracting the
expected noise magnitude spectrum
is obtained by subtracting the
expected noise magnitude spectrum
![]() from the magnitude signal spectrum
from the magnitude signal spectrum
![]() . Thus,
. Thus,
![]() ,
,
![]() and
and
![]()
![]() FFT length and
FFT length and
![]() the number of frames.
the number of frames. 
![]() = maximum value of noise residual (after spectral subtraction) measured during
non-speech activity. This process is to reduce the commonly known “musical
noise”.
= maximum value of noise residual (after spectral subtraction) measured during
non-speech activity. This process is to reduce the commonly known “musical
noise”. ![]() where
where
![]() is the noise spectral estimate.
is the noise spectral estimate.![]() , for T
, for T
![]()
![]() , otherwise.
, otherwise.![]() . The threshold of T is determined empirically.
. The threshold of T is determined empirically.
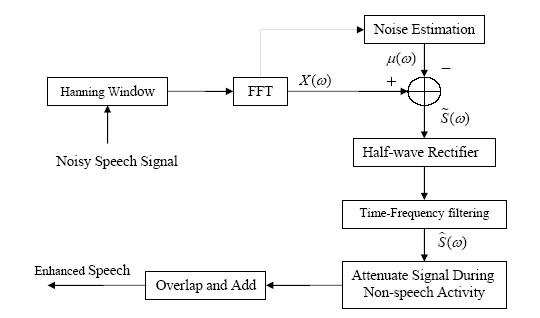
Figure
3 Block diagram of spectral subtraction with time-frequency filtering
This method
differs from the first method in several aspects.
1.
There is no longer any
VAD in this algorithm. Instead, we use a recursive system to estimate the noise
spectral magnitude.
![]()
where
![]() denotes the spectral magnitude at
frame k in subband (frequency bin) i
of the noisy speech sequence. Since considerable higher values occur at the
onset of speech, a threshold
denotes the spectral magnitude at
frame k in subband (frequency bin) i
of the noisy speech sequence. Since considerable higher values occur at the
onset of speech, a threshold
![]() is introduced where
is introduced where
![]() takes a value in the range of about
1.5 to 2.5. When the actual spectral component
takes a value in the range of about
1.5 to 2.5. When the actual spectral component
![]() exceeds this threshold, this is
considered as a rough detection of speech and the recursive accumulation is
stopped. Due to the assumption of long-term stationarity, we can use the noise
estimate prior to such frames as the noise estimate of them.
exceeds this threshold, this is
considered as a rough detection of speech and the recursive accumulation is
stopped. Due to the assumption of long-term stationarity, we can use the noise
estimate prior to such frames as the noise estimate of them.
2.
Time-Frequency
filtering
We
use time-frequency filtering to reduce the musical noise. It is performed using
several preceding and frames and several frames following the frame of interest.
The area of analysis is defined by the two regions shown below, region A and
region B.
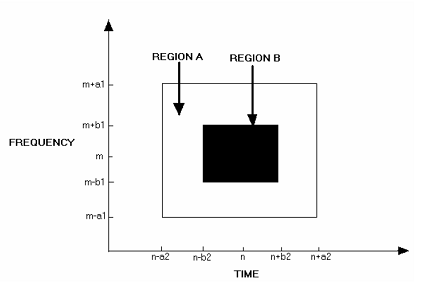
Figure
4 Analysis regions
Let
![]()
![]()
The
decision as to whether or not region B contains an isolated peak is made by
![]() , then region B contains an isolated peak
, then region B contains an isolated peak
Otherwise,
region B does not contain an isolated peak
where
![]() specifies the ratio of energies in
region A and B. Peaks that appear in several successive frames and occupy a
wide, or close to other spectral peaks are likely to be due to speech and are
unmodified by this procedure. On the contrary, isolated peaks are typically
caused by noise and hence removed by this step.
specifies the ratio of energies in
region A and B. Peaks that appear in several successive frames and occupy a
wide, or close to other spectral peaks are likely to be due to speech and are
unmodified by this procedure. On the contrary, isolated peaks are typically
caused by noise and hence removed by this step.
If
region B is considered to contain an isolated peak, then
![]() for
for
![]() and
and
![]() .
.
Otherwise,
we keep the original spectral components unchanged.
3.
Noise estimation
After
we get
![]() , we multiply it by
, we multiply it by
![]() to estimate noise spectrum. The
usual range of
to estimate noise spectrum. The
usual range of
![]() is 1.5 to 2.5. Large
is 1.5 to 2.5. Large
![]() tends to remove more noise, but also
introduce more speech distortion.
tends to remove more noise, but also
introduce more speech distortion.
4.
Modified half-wave
rectification
After
subtraction, the difference values having negative magnitudes are not set to
zero. However, we take the absolute value of them and attenuate by 50dB.
4.
Results For both
methods, Hanning window with 50% overlapping is used to segment and window the
input data. After spectral modification, the segments are overlapped and add
together to obtain the enhanced speech. 1.
Speech sample recorded
in a F16 cockpit voice recorder. 2.
Speech sample recorded
in a factory. 3.
Speech sample recorded
in a car. Before
converting spectral magnitude back to time domain, a smoothing of the PSD is
carried out for every frame to avoid large variation. The equation to smooth the
mth frame is given by:
where
![]()
![]() ranges from 0.5 to 0.9. In the
project, we use
ranges from 0.5 to 0.9. In the
project, we use
![]() . This smoothing is done for both methods.
. This smoothing is done for both methods.
Method One:
In the project,
we set the threshold of
![]() as 0.05 and
as 0.05 and
![]() as -12dB.
as -12dB.
Since the threshold of
![]() is determined
empirically, the VAD works well and detects most of the speech activities. The
following figure gives a typical example of VAD, the threshold is set at 0.05.
is determined
empirically, the VAD works well and detects most of the speech activities. The
following figure gives a typical example of VAD, the threshold is set at 0.05.
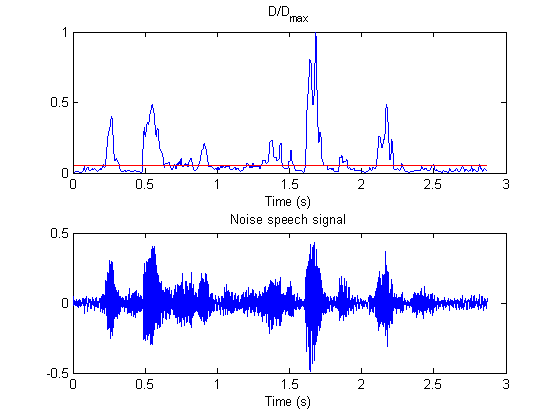
Figure 5 Typical VAD results
In this
algorithm, we take the average of the spectral magnitude of all frames which are
considered as non-speech as the noise estimate. In real time systems, the noise
estimate will be updated by every new input frame.
The following three figures show the waveforms of the clean signal, noisy signal and the enhanced signal in time and frequency domain recorded in a F16 cockpit voice recorder, in a factory and in a car, respectively.
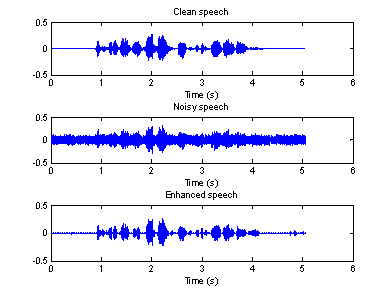
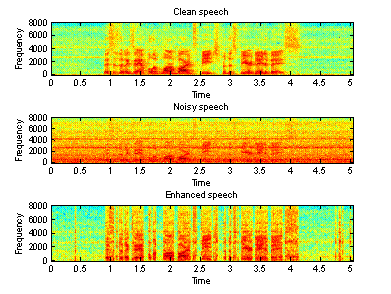
Figure 6(a) Time domain waveforms of clean, Figure 6(b) Spectrogram of clean, noisy
noisy and enhanced speeches (F16)
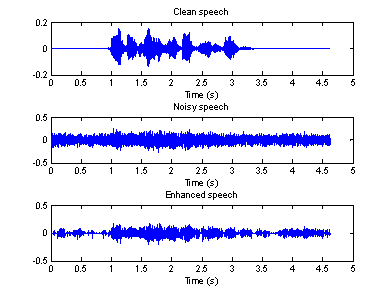
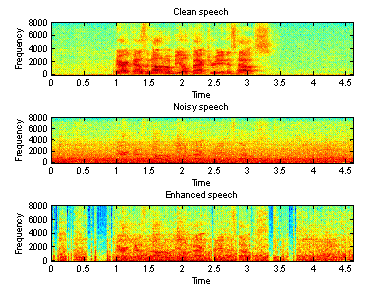
Figure 7(a) Time domain waveforms of clean, Figure 7(b) Spectrogram of clean, noisy
noisy and enhanced speeches (factory) and enhanced speeches (factory)
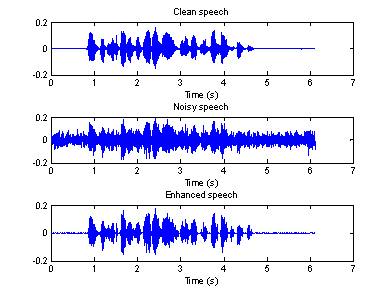
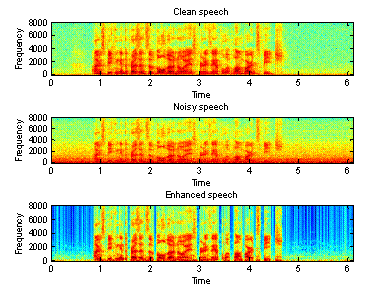
Figure 8(a) Time domain waveforms of clean, Figure 8(b) Spectrogram of clean, noisy
clean, noisy and enhanced speeches (car) and enhanced speeches (car)
From Figure
5-7, we can see that, the proposed algorithm does make some improvement. It does
not work very well, especially for the speech recorded in a factory. In
addition, there is still some distorting in the enhanced speech. Moreover, the
“musical noise” is present in all three enhanced speeches, and it is very
difficult to reduce it. Therefore, the intelligibility of the so-call enhanced
speeches may be even worse.
Method two:
In the project,
we use ![]() ,
,![]() ,
,![]() ,
,![]() ,
,![]() ,and
,and
![]() .
.
Figure 8-10 show the waveforms of the clean signal, noisy signal and the enhanced signal in time and frequency domain recorded in a F16 cockpit voice recorder, in a factory and in a car, respectively.
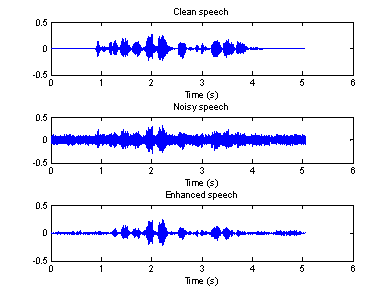
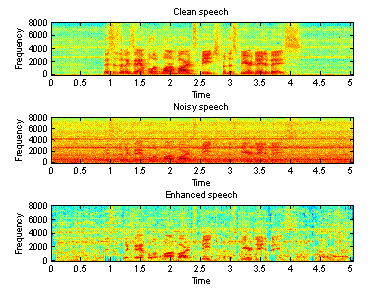
Figure 9(a) Time domain waveforms of clean, Figure 9(b) Spectrogram of clean, noisy
noisy and enhanced speeches (F16)
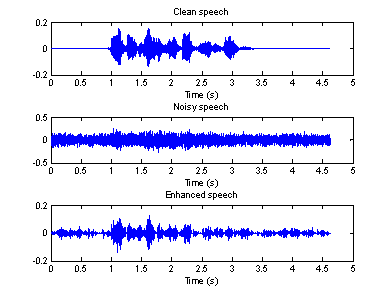
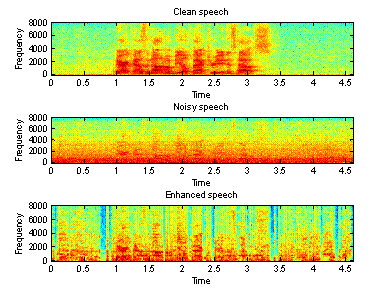
Figure 10(a) Time domain waveforms of clean, Figure 10(b) Spectrogram of clean, noisy
noisy and enhanced speeches (factory) and enhanced speeches (factory)
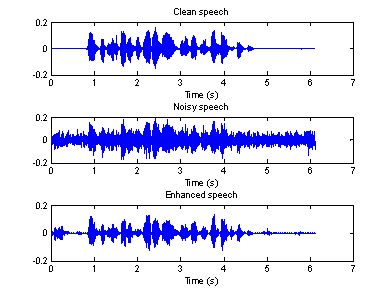
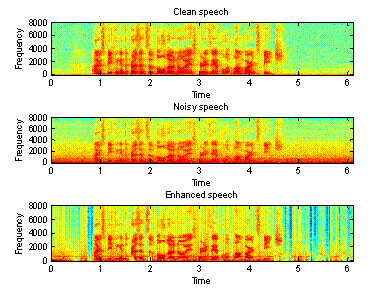
Figure 11(a) Time domain waveforms of clean, Figure 11(b) Spectrogram of clean, noisy
clean, noisy and enhanced speeches (car) and enhanced speeches (car)
From the above
figures, we can see that the second algorithm works better than the first one,
especially for the noisy speech recorded in a factory. However, there is still
some “musical noise” in the enhanced speech.
The recorded
clean and corrupted speech under various noise sources, and enhanced speech using different methods are listed in the follow table.|
Background noise |
Clean Speech |
Noisy Speech |
Enhanced Speech |
|
|
Method 1 |
Method 2 |
|||
|
F16 Noise |
||||
|
Factory Noise |
||||
|
Volvo Noise |
||||
Table 1 Clean, noisy and enhanced speech
The following tables show the SNR improvement by method two for four different sentences for four different background noises: F16 noise, factory noise, white noise and car noise.
Sentence
One: “Good service should be rewarded by
big tips.”
|
Background noise |
F16 Noise |
Factory Noise |
White Noise |
Volvo Noise |
|
Input
SNR |
2.74dB |
3.33dB |
2.37dB |
7.22dB |
|
Output
SNR |
3.24dB |
3.61dB |
1.41dB |
30.34dB |
|
SNR
Improvement |
0.50dB |
0.28dB |
-0.96dB |
23.12dB |
Table 2 SNR improvement for F16 noise
Sentence
Two: “The fifth jar contains big juicy
peaches.”
|
Background noise |
F16 Noise |
Factory Noise |
White Noise |
Volvo Noise |
|
Input
SNR |
3.26dB |
4.07dB |
3.32dB |
7.68dB |
|
Output
SNR |
6.74dB |
9.18dB |
6.37dB |
24.49dB |
|
SNR
Improvement |
3.52dB |
5.11dB |
3.05dB |
16.81dB |
Sentence
Three: “Draw every outline first then
fill in the interior.”
|
Background noise |
F16 Noise |
Factory Noise |
White Noise |
Volvo Noise |
|
Input
SNR |
4.35dB |
5.17dB |
4.08dB |
8.79dB |
|
Output
SNR |
8.49dB |
10.56dB |
7.09dB |
27.12dB |
|
SNR
Improvement |
4.14dB |
5.39dB |
3.01dB |
18.33dB |
Sentence
Four: “Scholars argue history.”
|
Background noise |
F16 Noise |
Factory Noise |
White Noise |
Volvo Noise |
|
Input
SNR |
9.21dB |
8.98dB |
8.77dB |
13.75dB |
|
Output
SNR |
20.30dB |
24.56dB |
19.34dB |
32.06dB |
|
SNR
Improvement |
11.09dB |
15.58dB |
10.57dB |
18.31dB |
Table 5 SNR improvement for car noise
From the above
tables, we can see that the higher input SNR result in larger SNR improvement.
This is because for higher input SNR, the speech signal is less corrupted so
that it is easier to restore the speech from background noise and hence achieve
larger SNR improvement.
5.
Discussion
For the first
method, we found that although the residual noise reduction would reduce the
musical noise a little, it would also cause great distortion of the speech.
Therefore in practice, we do not use this step in the project. Hence the musical
noise is very obvious in the first method.
![]() is chosen so that most of the onset of the speech can be detected. Empirically,
we set it as 2.
is chosen so that most of the onset of the speech can be detected. Empirically,
we set it as 2.
![]() determines the level to which the noise is removed. Too small values of
determines the level to which the noise is removed. Too small values of
![]() do not make the approach to work
well for the purpose of reducing noise, while too large values will cause too
much speech distortion. During our project, we found that
do not make the approach to work
well for the purpose of reducing noise, while too large values will cause too
much speech distortion. During our project, we found that
![]() =1.5 is a good choice. Other choices of parameters are also determined
empirically.
=1.5 is a good choice. Other choices of parameters are also determined
empirically.
Reference
[1] Speech Database: http://cslu.cse.ogi.edu/nsel/data/SpEAR_database.html
[2] Speech Enhancement: Concept and Methodology: http://cslu.cse.ogi.edu/nsel/data/SpEAR_database.html
[3] Speech Enhancement, a project report: http://web.mit.edu/sray/www/btechthesis.pdf
[4] Kalman Filtering and Speech Enhancement: http://cmp.felk.cvut.cz/~kybic/dipl/